
Task 8 : Concept of Mode for group data
Again, we are taking the example of a Mathematics Test.
A Mathematics teacher of grade IX took a surprise test (out of 100). The result of test of 50 students is given below:
13, 26, 33, 18, 27, 2, 33, 22, 12, 24, 35, 99, 56, 31, 63, 89, 86, 30, 14, 22, 16, 16, 11, 8, 11, 30, 22, 69, 73, 88, 36, 55, 49, 34, 83, 4, 17, 7, 8, 75, 13, 23, 3, 1, 3, 1, 11, 4, 12, 22
Try to find the mode of the given data.
Share and discuss the possible methods for finding mode in your class.
How do you find the mode of the data when the number of observations is more than 100?
Now, try to find the mode of the given data using the group frequency distribution table.
Think and discuss with your group about the possible methods to find the mode of the group data.
Observe the method suggested here and find the mode of the group data.


process.
NOTE :
Mode is the most repeated value among the given set of data.
Which class interval contains the highest frequency?
INFORMATION :
The class with the highest frequency is called Modal class.
NOTE :
We don’t know any value of the class intervals. In such case we have to estimate the values
between the intervals.
What process was adopted by the teacher in finding the mode in the above situation?
Why does the teacher not take the middle value of the modal class as an estimated value of
mode? What other factors the teacher considered in the given method?
What is the ratio of difference between the modal class frequency and class preceding the modal class frequency & Modal class frequency and class succeeding the modal class frequency?
In the given process what value is added in the lower limit of the class interval?
If we placed 12– 8 in place of 12–10 in the numerator of the given expression,
12−10
Mode = 10 + _________________ ×10
(12−10)+(12−8)
then what will be the new expression for finding the mode of the group data?
Compare the value of mode we get from group and ungroup data. Discuss the possible reasons behind the variation in the value.
NOTE

The abscissa of the point of intersection of two lines AB and CD is the mode of the data.
Formula for finding mode in group data is
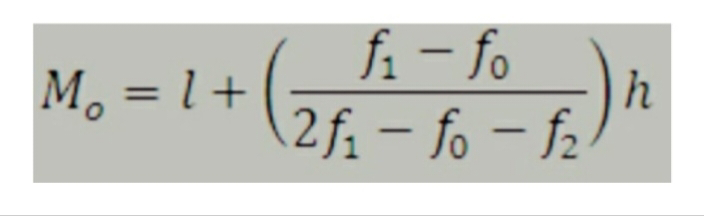
Where
I = lower limit of the modal class,
h = size of the class interval (assuming all class sizes to be equal),
f₁ = frequency of the modal class,
fo = frequency of the class preceding the modal class,
f2 = frequency of the class succeeding the modal class,
Group discussion:
Which is the most effective way to measure central tendency in a group data? Justify.
Practice work
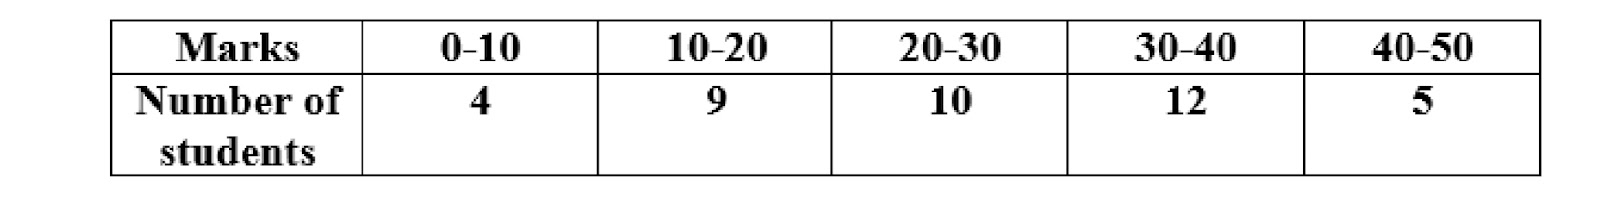

1. Find the mode of the following frequency distribution table:
2. Find the mode of the following frequency distribution table:
Post a Comment
Post a Comment